PyTorch Profiling
This guide covers profiler invocation. For installation and XPU backend setup, see the PyTorch documentation.
Basic profiling
The following code profiles CPU and XPU activity while running a simple ResNet18 model from torchvision:
import torch
import torchvision.models as models
from torch.profiler import profile, ProfilerActivity

model = models.resnet18().to("xpu")
inputs = torch.randn(5, 3, 224, 224, device="xpu")

def trace_handler(prof):
    print(prof.key_averages().table(sort_by="xpu_time_total", row_limit=10))
    prof.export_chrome_trace("trace.json")

with profile(
    activities=[ProfilerActivity.CPU, ProfilerActivity.XPU],
    on_trace_ready=trace_handler,
) as prof:
    model(inputs)
    torch.accelerator.synchronize()
When the with block exits, trace_handler prints the operator table and writes trace.json to the current directory. The explicit torch.accelerator.synchronize() call waits for outstanding device work before the profile results are read.
This example intentionally profiles the first model invocation. Because it has no separate warm-up phase or profiler schedule, its results include first-use initialization and warm-up overhead. Use the scheduled capture below when you need a representative steady-state trace.
Scheduled capture
Use schedule to separate inactive, warm-up, and active recording steps and to bound the capture inside a training or inference loop. Warm-up events are collected and then discarded rather than included in the final trace:
from pathlib import Path

import torch
import torchvision.models as models
from torch.profiler import profile, ProfilerActivity, schedule

model = models.resnet18().to("xpu")
inputs = torch.randn(5, 3, 224, 224, device="xpu")
trace_dir = Path("trace_dir")
trace_dir.mkdir(parents=True, exist_ok=True)

def trace_handler(prof):
    step_num = prof.step_num
    print(prof.key_averages().table(sort_by="xpu_time_total", row_limit=10))
    prof.export_chrome_trace(str(trace_dir / f"trace_step_{step_num}.json"))

with profile(
    activities=[ProfilerActivity.CPU, ProfilerActivity.XPU],
    schedule=schedule(wait=1, warmup=1, active=2, repeat=1),
    on_trace_ready=trace_handler,
) as prof:
    for step in range(10):
        model(inputs)
        torch.accelerator.synchronize()
        prof.step()
The schedule arguments control each capture cycle:
Argument |
Meaning |
|---|---|
|
Run one step without recording before the warm-up phase. |
|
Record one step and discard its events, allowing the profiler itself to warm up. |
|
Record and retain two steps. After this phase, |
|
Run the |
The wait phase does not collect profiler events and therefore avoids profiling collection overhead. The warmup and active phases do collect events. Keep the warmup and active phases as short as the capture requires, and use wait to space captures across longer runs.
The optional skip_first argument skips a specified number of initial steps once, before the repeated schedule cycles begin.
Common options
These options add collection overhead. Enable them only when the additional detail they capture is needed:
Option |
Effect |
Overhead note |
|---|---|---|
|
Records tensor shapes per operator |
Can add substantial overhead from shape bookkeeping per operator call |
|
Tracks tensor memory allocation/deallocation |
Adds memory tracking per allocation event |
|
Captures Python call stacks per event |
Adds explicit stack-tracing overhead and produces large trace files |
|
Adds a named, user-defined span to the trace |
Adds small annotation overhead. Use it to label regions of interest |
|
Invokes a callback with the completed trace. Use it to save traces, for example with |
No profiling overhead. Controls what happens to the completed trace |
Without a schedule, on_trace_ready is called once, when the profile context exits. With a schedule, it is called once per completed wait -> warmup -> active cycle, right after the last active step. It receives the profiler object, so it can save the trace with prof.export_chrome_trace(). Without it, the profiler still records events but nothing is exported automatically.
Activity filtering
Note
This feature requires PyTorch 2.12 or later.
ProfilerActivity.XPU collects every default XPU activity type. To collect only some of them, pass a dictionary that lists the activity types to keep:
with profile(
    activities=[
        ProfilerActivity.CPU,
        {ProfilerActivity.XPU: ["CONCURRENT_KERNEL", "GPU_MEMCPY"]},
    ],
) as prof:
    model(inputs)
    torch.accelerator.synchronize()
The XPU activity type names are GPU_MEMCPY, GPU_MEMSET, GPU_USER_ANNOTATION, CONCURRENT_KERNEL, XPU_RUNTIME, XPU_DRIVER, and OVERHEAD. A list collects exactly the activities it names, so an empty list, {ProfilerActivity.XPU: []}, collects no XPU activity. Any other name in the XPU list is treated as a hardware metric name and enables Scope Profiler.
XPU_RUNTIME and XPU_DRIVER are also in the default ProfilerActivity.CPU set, so plain ProfilerActivity.CPU collects them even when the XPU list leaves them out, as in the example above. To drop them, filter the CPU group too:
activities=[
    {ProfilerActivity.CPU: ["CPU_OP", "USER_ANNOTATION", "EXTERNAL_CORRELATION"]},
    {ProfilerActivity.XPU: ["CONCURRENT_KERNEL", "GPU_MEMCPY"]},
]
Without XPU_RUNTIME, the trace has no flow arrows from launch calls to kernels.
XPU memory inspection
profile_memory=True records allocation and deallocation information in profiler events. PyTorch does not currently document a supported XPU allocation-history export: the legacy export_memory_timeline() method is deprecated, and no non-deprecated XPU replacement is available.
For a point-in-time allocator view instead, use the public torch.xpu.memory_snapshot() and torch.xpu.memory_stats() APIs.
XPU graph replay
Note
XPU graph replay profiling requires PyTorch 2.15 or later.
PyTorch 2.15 is the first release whose XPU wheels ship intel-pti 1.1.0. On Intel Arc B-series GPUs, the driver must be version 1.15.39122 or later, as reported by torch.xpu.get_device_properties().driver_version. With older driver versions, the trace shows one kernel no matter how many replays run.
The profiler records every kernel of each torch.xpu.XPUGraph replay. The graph can be captured before profiling starts:
import torch
from torch.profiler import profile, ProfilerActivity

model = torch.nn.Linear(1024, 1024).to("xpu")
x = torch.randn(64, 1024, device="xpu")

with torch.no_grad():
    model(x)  # warm up before capture
    g = torch.xpu.XPUGraph()
    with torch.xpu.graph(g):
        y = model(x)

with profile(activities=[ProfilerActivity.CPU, ProfilerActivity.XPU]) as prof:
    for _ in range(5):
        g.replay()
    torch.accelerator.synchronize()

print(prof.key_averages().table(sort_by="xpu_time_total", row_limit=10))
prof.export_chrome_trace("xpu_graph_trace.json")
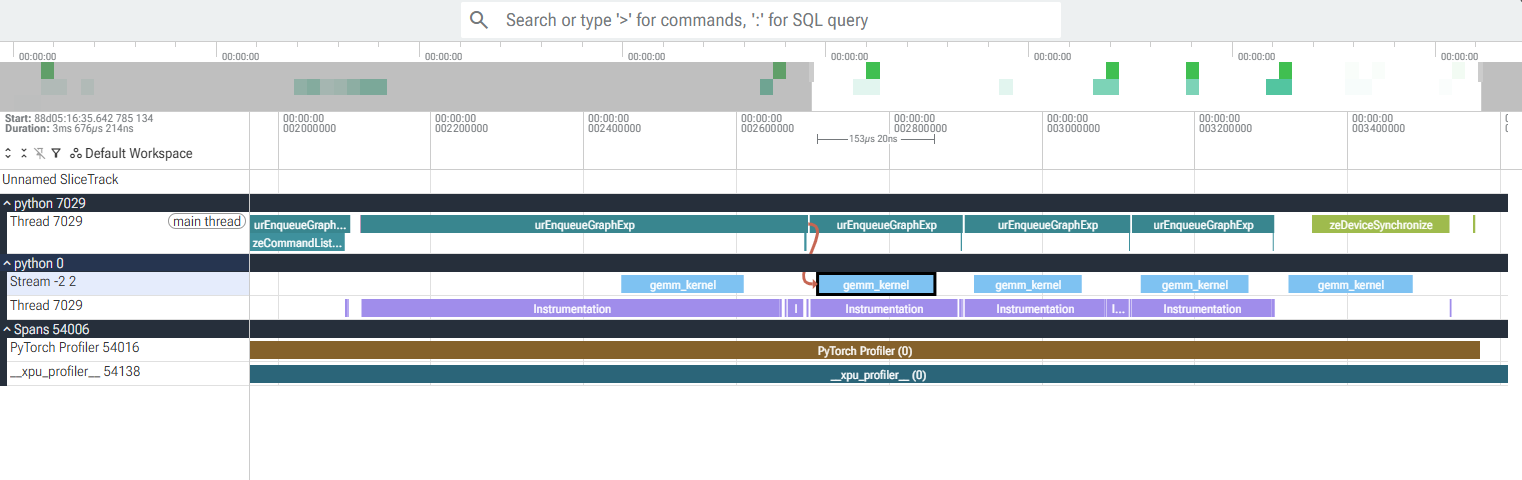
The graph holds one gemm_kernel, so 5 replays show 5 calls, each launched by one urEnqueueGraphExp runtime call:
-----------------------------------------  ------------  ------------  ------------  ------------  ------------  ------------  ------------  ------------  ------------  ------------
                                     Name    Self CPU %      Self CPU   CPU total %     CPU total  CPU time avg      Self XPU    Self XPU %     XPU total  XPU time avg    # of Calls
-----------------------------------------  ------------  ------------  ------------  ------------  ------------  ------------  ------------  ------------  ------------  ------------
                              gemm_kernel         0.00%       0.000us         0.00%       0.000us       0.000us     661.665us       100.00%     661.665us     132.333us             5
    zeCommandListIsGraphCaptureEnabledExt         0.02%       0.424us         0.02%       0.424us       0.085us       0.000us         0.00%       0.000us       0.000us             5
                        urEnqueueGraphExp         3.89%      91.109us        95.19%       2.232ms     446.377us       0.000us         0.00%       0.000us       0.000us             5
                          Instrumentation        82.03%       1.923ms        82.03%       1.923ms       6.029us       0.000us         0.00%       0.000us         0.000us           319
              zeCommandListAppendGraphExt         9.30%     218.165us         9.30%     218.165us      43.633us       0.000us         0.00%       0.000us         0.000us             5
                      zeDeviceSynchronize         4.76%     111.627us         4.76%     111.627us      55.813us       0.000us         0.00%       0.000us         0.000us             2
-----------------------------------------  ------------  ------------  ------------  ------------  ------------  ------------  ------------  ------------  ------------  ------------
Self CPU time total: 2.345ms
Self XPU time total: 661.665us
In Perfetto, each urEnqueueGraphExp call on the CPU thread launches one gemm_kernel on the device stream. The arrow links the selected kernel to the call that launched it:
A graph with several kernels is still launched by one urEnqueueGraphExp call per replay. To try it, replace the model in the snippet with:
model = torch.nn.Sequential(
    torch.nn.Linear(1024, 1024), torch.nn.ReLU(),
    torch.nn.Linear(1024, 1024), torch.nn.GELU(),
    torch.nn.Softmax(dim=-1),
).to("xpu")
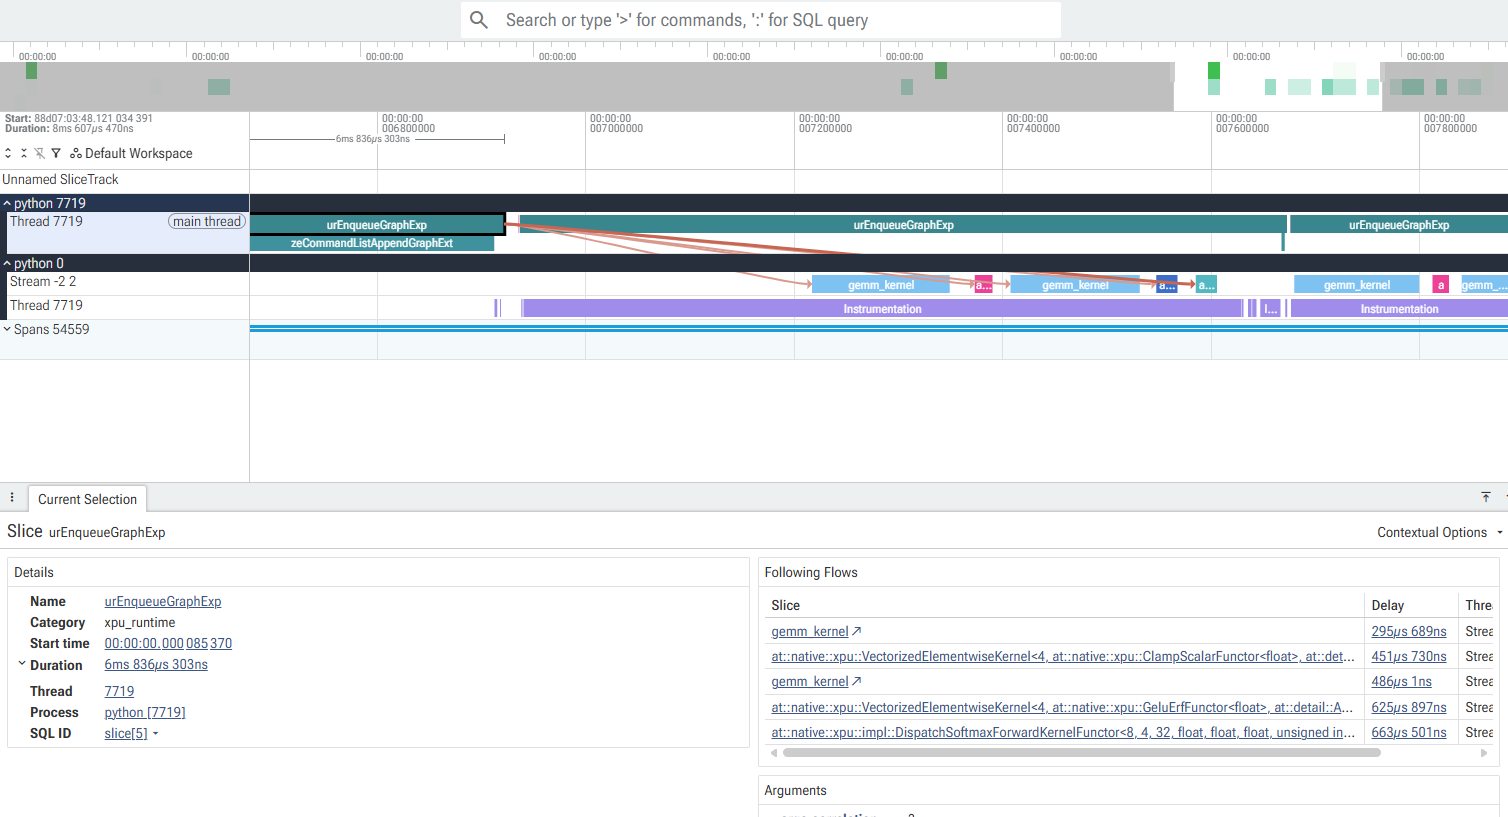
Each replay then runs five kernels in capture order: two gemm_kernel and the ReLU, GELU, and softmax kernels. Over 5 replays, gemm_kernel shows 10 calls and each of the other kernels shows 5. Selecting a urEnqueueGraphExp call in Perfetto draws arrows to all the kernels it launched and lists them under Following Flows:
Inspecting profiler results
The following examples use traces from the previous PyTorch section. Traces from the framework integrations have the same export format and can be opened and read in the same way.
Text summary
Use prof.key_averages().table(sort_by="xpu_time_total") to print a per-operator summary sorted by total XPU time. The summary includes self and total CPU/XPU time, averages, and call counts. The following output comes from the trace_handler in the Scheduled Capture example above, where row_limit=10 limits the table to 10 rows:
-------------------------------------------------------  ------------  ------------  ------------  ------------  ------------  ------------  ------------  ------------  ------------  ------------
                                                   Name    Self CPU %      Self CPU   CPU total %     CPU total  CPU time avg      Self XPU    Self XPU %     XPU total  XPU time avg    # of Calls
-------------------------------------------------------  ------------  ------------  ------------  ------------  ------------  ------------  ------------  ------------  ------------  ------------
                                          ProfilerStep*        14.81%       1.639ms       100.00%      11.071ms       5.535ms       9.319ms       160.65%      15.120ms       7.560ms             2
                                          ProfilerStep*         0.00%       0.000us         0.00%       0.000us       0.000us       9.319ms       160.65%       9.319ms       4.660ms             2
                                           aten::conv2d         0.28%      30.559us        28.30%       3.133ms      78.318us       0.000us         0.00%       4.279ms     106.986us            40
                         aten::convolution_overrideable        15.77%       1.746ms        26.10%       2.890ms      72.246us       4.279ms        73.77%       4.279ms     106.986us            40
                                               gen_conv         0.00%       0.000us         0.00%       0.000us       0.000us       3.584ms        61.79%       3.584ms      89.612us            40
                                aten::native_batch_norm        16.05%       1.777ms        32.45%       3.593ms      89.826us       1.060ms       18.28%       1.060ms      26.512us            40
-------------------------------------------------------  ------------  ------------  ------------  ------------  ------------  ------------  ------------  ------------  ------------  ------------
Self CPU time total: 11.071ms
Self XPU time total: 5.801ms
In this run, ProfilerStep* marks the full active profiling window, which includes both recorded steps. It appears twice: the first row is the host-side annotation, and the second, with no CPU time, is its copy on the device stream. aten::* rows are CPU-side operators that launch work, and gen_conv is the actual device kernel dispatched by aten::convolution_overrideable. ProfilerStep* is a synthetic annotation, not a real kernel, and PyTorch excludes annotations from the total self-XPU-time sum used as the percentage denominator. Its own self XPU time is still divided by that smaller sum, so its Self XPU % can exceed 100%. This is a reporting artifact of the percentage formula, not overlapping kernel execution.
Timeline view
Use Perfetto to inspect exported .json or .json.gz trace files. The timeline correlates CPU-side operator and runtime calls with the XPU kernels and memory copies they launch. When Scope Profiler is enabled, the timeline also includes hardware metric counters.
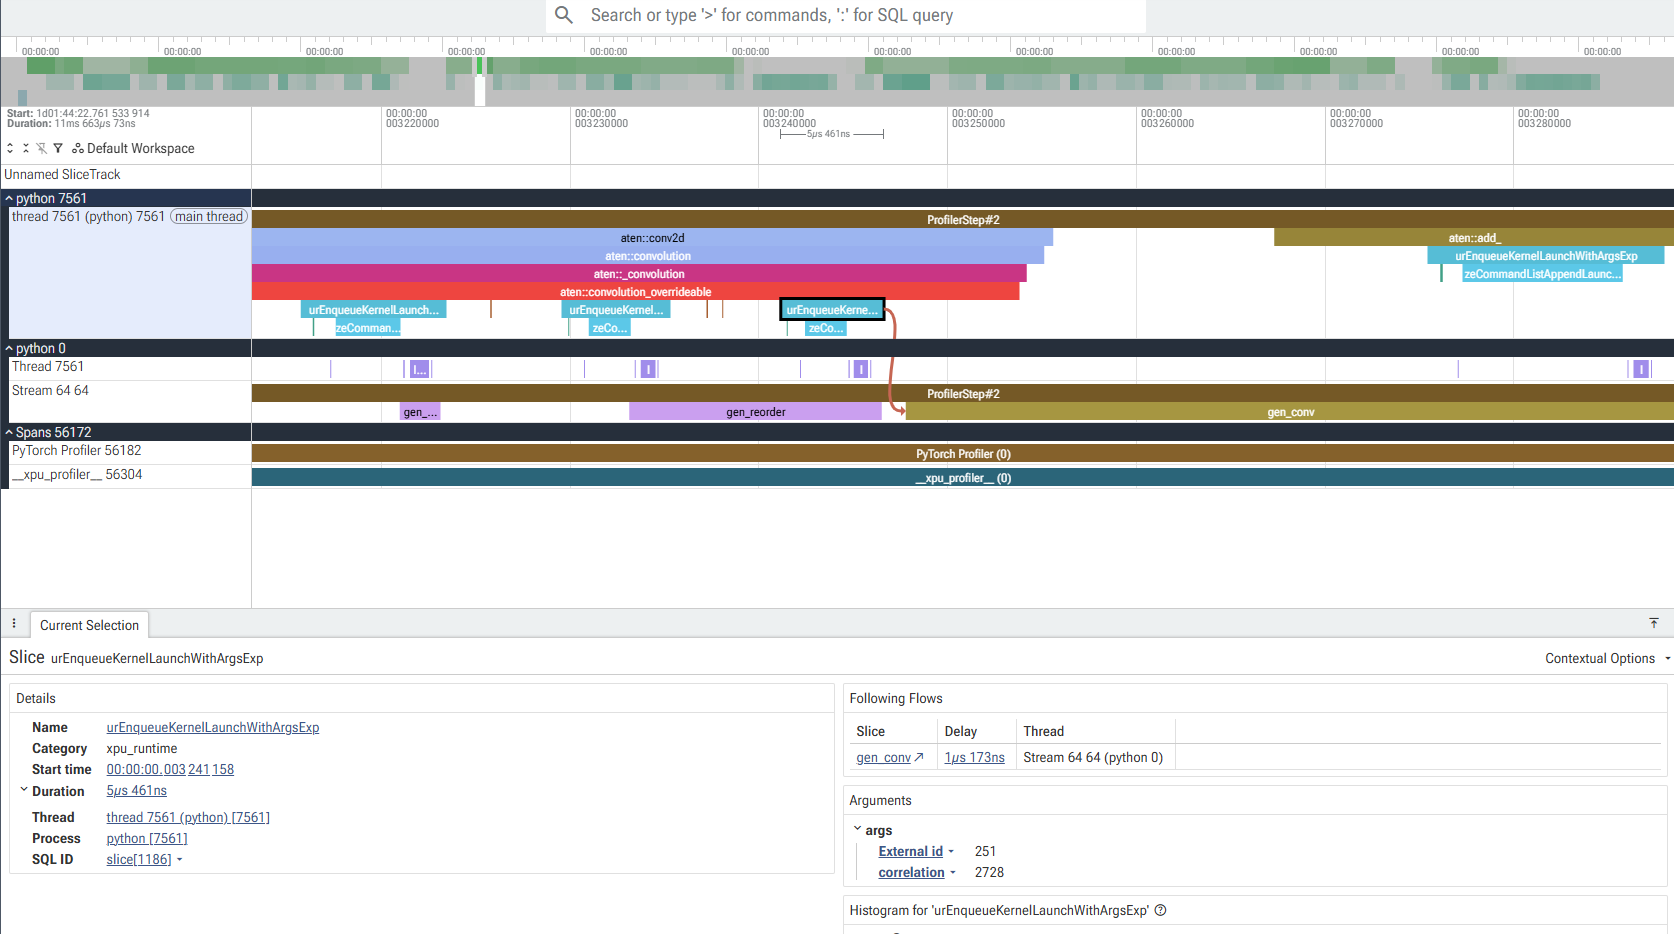
Perfetto groups the trace into three processes, each with a PID recorded in the Chrome-trace JSON:
python <pid>, the profiled process, contains onethread <pid> (python) <pid>track. This track shows the host-sideProfilerStep*bar, nestedaten::*operator calls such asaten::convolution_overrideableandaten::native_batch_norm, and the XPU runtime and driver calls those operators issue. Kernel launches appear as Unified Runtime calls in theurEnqueueKernel*family, such asurEnqueueKernelLaunchWithArgsExp. Each call has a nested Level Zero driver call, such aszeCommandListAppendLaunchKernelWithArguments.python 0is Kineto’s synthetic device process and contains two tracks:Thread <pid>has the same thread ID as the host thread. It contains Kineto’s profiling-overhead bookkeeping as genericInstrumentationslices. Theoverhead count,overhead occupancy, andoverhead costarguments describe the profiler’s per-event cost, not application or device activity.Stream <id>shows device kernel executions such asgen_conv, along with their device-side start times and durations. These appear beneath the device-side copy of theProfilerStep*annotation. Clicking aurEnqueueKernel*call on the host thread draws a flow arrow to the kernel it launched, as shown above.
Spansis Kineto’s bookkeeping process, not an application process. It contains two tracks:PyTorch Profilerfor the CPU-side collection span and__xpu_profiler__for the XPU-side collection span. Each track shows when that side of the profiler was actively recording.
Selecting a bar on any track shows its exact timestamps and duration in the side panel, and clicking a device kernel traces its launching call through the flow arrow described above.