Scope Profiler and Hardware Metrics
Scope Profiler extends torch.profiler on Intel XPU with device-specific hardware performance metrics, reported alongside kernel activities. Use it after or alongside a standard trace to analyze a bottleneck kernel’s utilization, stalls, and clock or frequency behavior in greater detail.
Note
Scope Profiler requires PyTorch 2.14 or later.
Collecting hardware metrics adds overhead to every kernel: PTI wraps each launch in a hardware metric query and reads the result back. For timing measurements, use a trace collected without hardware metrics.
Requirements
Complete these requirements before collecting hardware metrics:
Install the
intel-metrics-discoveryandintel-metrics-librarypackages. PTI needs them to resolve metric groups on the device. Without them, Scope Profiler silently collects no metrics. The base compute-runtime/driver installation from the common XPU setup may not include them, so install them explicitly if metric groups are missing.On Ubuntu, both packages are available through the
intel-graphicsPPA. Follow Installing Packages from Ubuntu PPA to add the driver and configure the PPA, then install the metric packages:sudo apt-get install -y intel-metrics-discovery intel-metrics-library
Alternatively, build both libraries from the source repositories linked above.
Set
ZET_ENABLE_METRICS=1in the environment of the profiled process. For example, export it in the shell used to launch that process.Enable performance-counter access at the driver level. The setting is controlled by
/proc/sys/dev/xe/observation_paranoid. The following script checks that the control exists and applies the required value:Warning
The
sysctl -wcommand changes a host-level driver setting. It affects every process and user on the machine, not only the profiled process. The change normally reverts on reboot unless an administrator has configured it to persist, for example in a sysctl config file. Do not run it on a shared host without administrator approval.export ZET_ENABLE_METRICS=1 if [ ! -e /proc/sys/dev/xe/observation_paranoid ]; then echo "The Xe performance-counter control is not available; cannot enable metrics." >&2 exit 1 fi sudo sysctl -w dev.xe.observation_paranoid=0
Metric selection
Scope Profiler uses the activity filtering syntax. Names in the ProfilerActivity.XPU list that are not XPU activity types are forwarded as hardware metric names, and listing at least one enables Scope Profiler. It collects only the listed metrics. Metric names such as GpuTime and GpuCoreClocks are device and driver specific. See Metric Availability.
from torch.profiler import profile, ProfilerActivity

activities = [
    ProfilerActivity.CPU,
    {ProfilerActivity.XPU: [
        "GPU_MEMCPY",
        "GPU_MEMSET",
        "GPU_USER_ANNOTATION",
        "CONCURRENT_KERNEL",
        "XPU_RUNTIME",
        "XPU_DRIVER",
        "OVERHEAD",
        "GpuTime",
        "GpuCoreClocks",
    ]},
]

with profile(activities=activities) as prof:
    model(x)
    torch.accelerator.synchronize()

prof.export_chrome_trace("trace.json")
print(prof.key_averages().table(sort_by="self_xpu_time_total"))
Kernel activity is always collected with metrics to correlate metrics with kernels. List other XPU activity types explicitly. XPU_RUNTIME and XPU_DRIVER are exceptions: ProfilerActivity.CPU collects them even when they are omitted from the XPU activity list. See Activity Filtering for details. The example above lists all XPU activity types to keep the full trace. Requesting only metrics drops memory-copy activity, and PyTorch prints a warning.
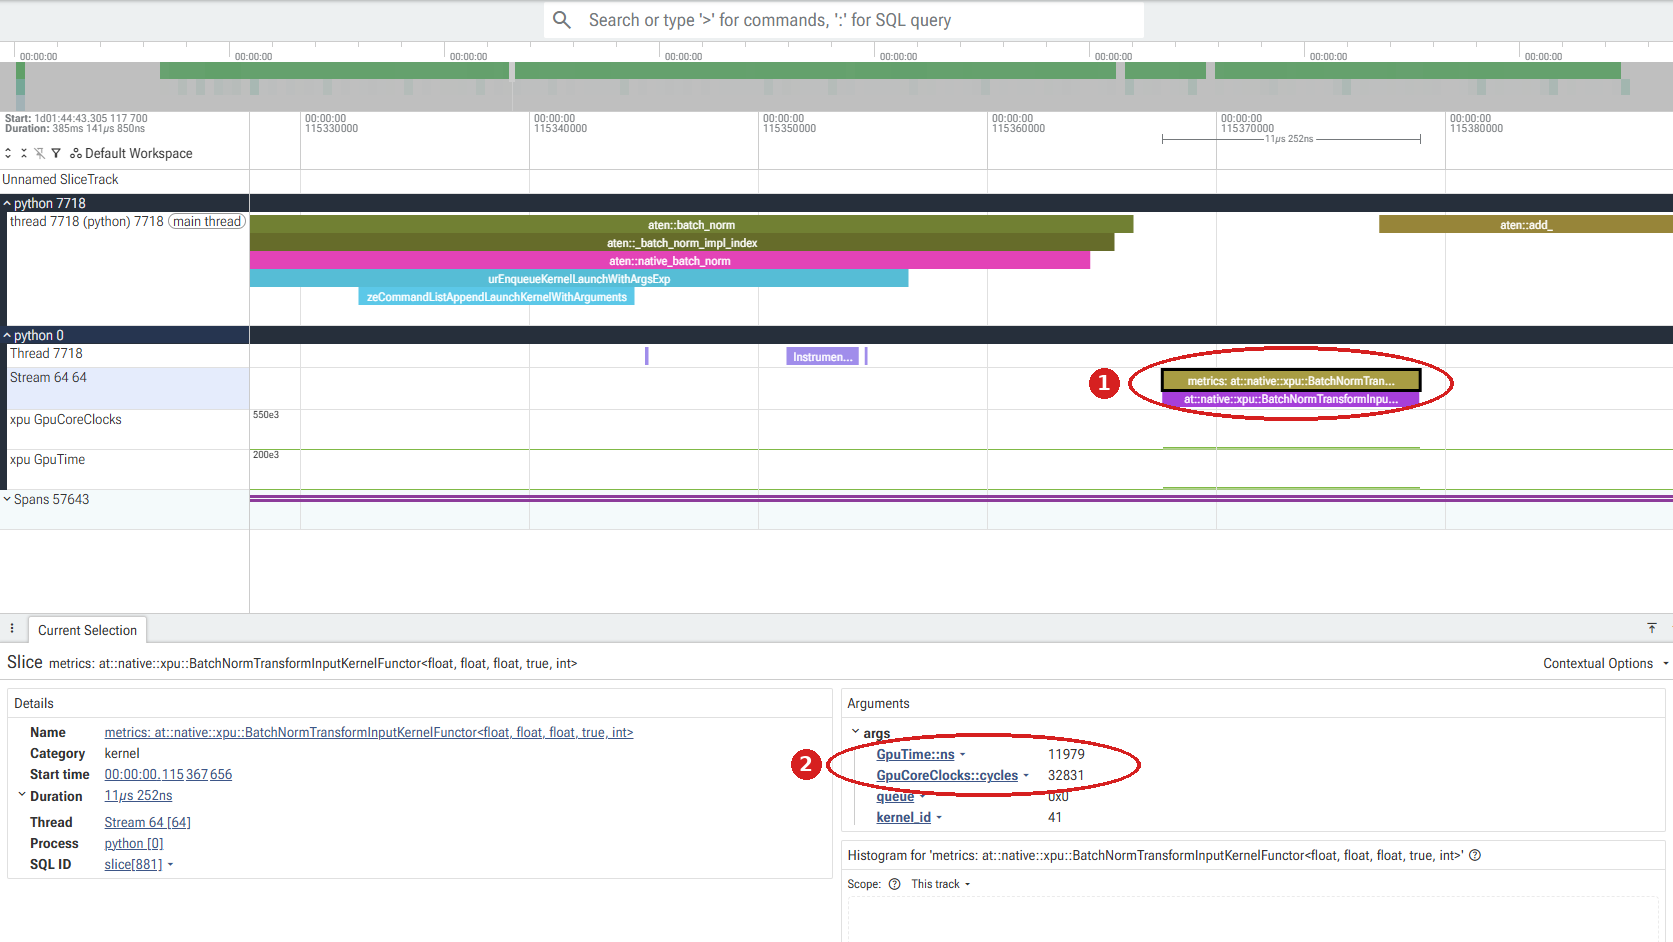
Metrics appear in the exported trace as metrics: ... events, which are visible as Perfetto counters when the trace is opened. They are also aggregated into the key_averages() summary table. In Perfetto, each metrics: <kernel> slice sits above its kernel on the stream track (1), and selecting it shows the metric values (2). Each metric also gets a counter track, such as xpu GpuTime:
Metric availability
There is no universal static list of Scope Profiler metrics. Metric groups and names are defined by the device and driver, and PyTorch does not expose a Python API for enumerating them.
As a practical discovery path, collect metrics with PTI Unitrace and inspect the metric data file. See Analyze Performance Metrics.